In the ever-evolving world of finance, visual aids have become a staple for traders and investors. One such visual aid that has won considerable attention is the candlestick chart. An integral part of technical analysis, it has a rich history dating back to the 18th century. Whether you are new to trading or you’re a seasoned investor looking to refine your analysis skills, understanding candlestick chart patterns can prove to be a game-changer. Keep reading to delve deep into the realm of candlestick charts.
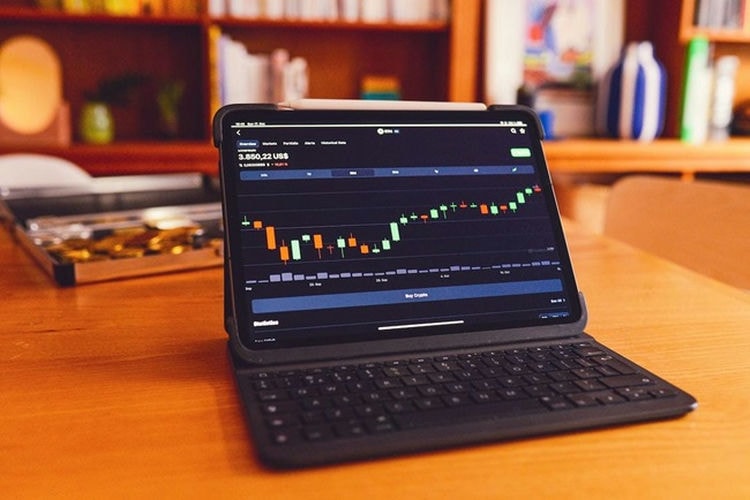
Table of Contents
Basics of Candlestick Charts
A candlestick chart is a popular tool used in technical analysis to visualize price movements of financial assets such as stock shares, currencies, or commodities over a certain period of time. It provides traders and investors with a visual representation of the market sentiment and helps them make informed decisions about buying or selling.
The candlestick chart is made up of a collection of rectangular shapes that represent the opening, closing, high, and low prices for a specific time period. Two wicks, usually referred to as shadows, and a body make up each candlestick. The wicks of the candlestick indicate the peak and low prices during that time period, while the body of the candlestick shows the price range between the opening and closing values.
Understanding candlestick chart patterns is crucial for forecasting price changes. Each candlestick pattern reflects the sentiment of the market’s buyers and sellers. Investors often use these patterns to anticipate future price movements and to plan their trading strategies accordingly. It’s noteworthy that while candlestick patterns can give valuable insight into market trends, they should be used alongside other tools for an informed and balanced trading strategy.
The Importance of Candlestick Chart Patterns
Candlestick chart patterns play an integral role in shaping a trader’s strategy. These patterns paint a comprehensive view of the market sentiment, visually identifying the swings and resulting trends. They can show the relationship between the open and close as well as the high and low of the trading period. Additionally, these patterns help in distinguishing market reversals, continuations, and the strength of the trend.
High-frequency traders and day traders often rely on candlestick chart patterns for intraday trading due to their ability to provide a real-time read on market sentiment. Furthermore, these patterns aid in pinpointing the crucial resistance and support levels in the market.
Types of Candlestick Patterns
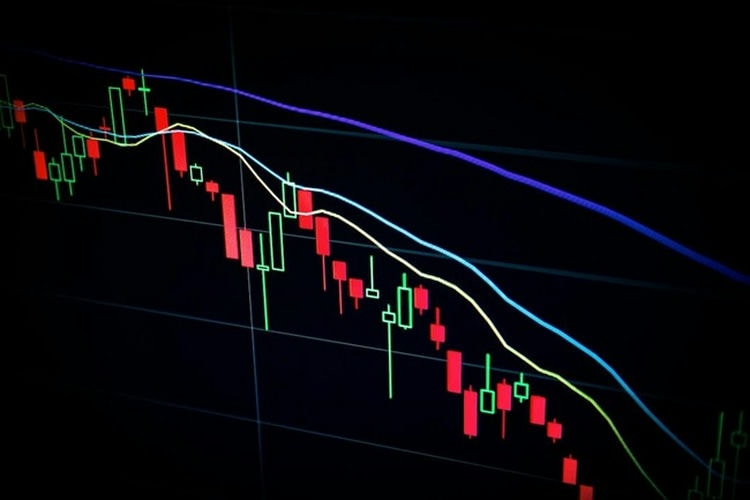
The strength of a candlestick chart lies in its ability to generate patterns that can signal to traders potential bullish or bearish trends in the market. Some of the commonly recognized patterns are Doji, Hammer, Engulfing Pattern, and Shooting Star. Each of these has characteristic shapes and implications.
The Doji candlestick pattern, for instance, symbolizes a battle between buyers and sellers, with the closing price approximately the same as the opening price. It can indicate indecision in the market. A Hammer, on the other hand, is shaped like a hanging man and symbolizes a potential price bottom and bullish reversal.
It’s important to remember that while knowing each of these patterns can boost your analysis, understanding the context in which these patterns occur is equally crucial. Each pattern may have a different implication based on the preceding price action and the overall market trend.
Candlestick Patterns: A Piece of the Financial Puzzle
Candlestick chart patterns are a valuable tool in the arsenal of financial traders. Their ability to vividly depict the battle between buyers and sellers makes them an indispensable part of trading. However, it’s pertinent to remember that these patterns are just one piece of the trading puzzle.
At the end of the day, financial trading is a complex field that requires a blend of knowledge, tools, and experience. Navigating this field confidently requires a robust grasp of fundamental analysis, sound judgment, and thoughtful strategies.
By bringing together an understanding of candlestick patterns, education, practice, and reliable software, traders can develop a noteworthy edge in this fast-paced market. With these tools in hand, they can effectively decode the signals these patterns present and seize the profitable trading opportunities that may arise.
Overall, candlestick charts offer a fascinating glimpse into the world of trading. Their potential to reveal the market’s sentiments, predict future trends, and form the backdrop of powerful trading decisions cannot be underestimated. Candlestick patterns are not a magic bullet, but when used judiciously, they can definitely enhance the chances of success in financial trading.


